Graphic Design Resources
Although there are some sample images in the media shipped with the device, you are mostly on your own when it comes to defining the graphics for a gauge cluster. This can be complex or simple depending upon what it is you need.
I use Inkscape for designing gauges because everything is vector based, making it easy to change things during the design process. It also allows different sizes of the same gauge to be exported as raster files.
The the required format for images in SDC is very specific. Images must be 32bit bitmaps (.bmp files) in the ARGB format. Inkscape can only export PNG files so you must convert them to BMP after exporting. I use GIMP, a free raster image editing tool, for that.
To get a gauge designed in Inkscape, here are a couple of resources: Create a tachometer in Inkscape https://goinkscape.com/how-to-create-a-tachometer-in-inkscape/
The instructions here are for a slightly older version of inkscape but the process is still valid. Some tools may have moved around a bit.
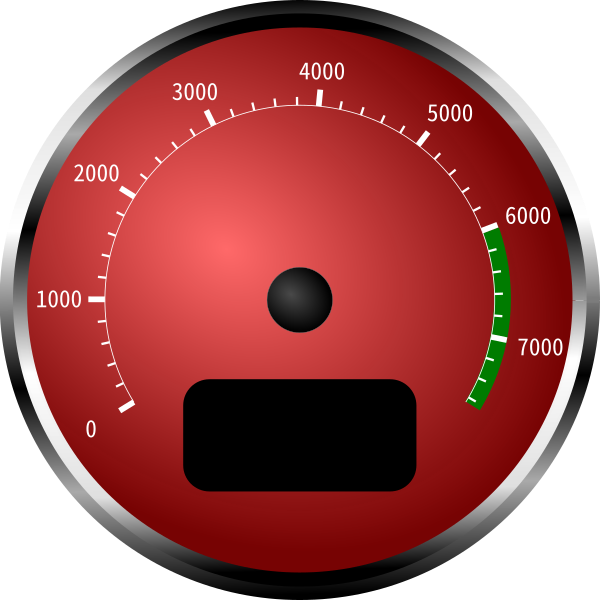
https://www.blocklayer.com/gauge-templates This tool has a number of sliders and other controls which allow you to design a basic gauge layout and save it as an SVG file. This vector file format can be loaded directly into Inkscape, where you can then edit it further to get the look you want. For example, you might want to add some 3d effects to the face, light shading, etc. Or make a black hole in the gauge to display another value inside (such as is done for the odometer in one of my demo pagesets).
Here is an example of a gauge designed using the blocklayer website. It was saved as an SVG, imported into inkscape, and tweaked slightly - change the background to red, and add a gradient, and I think I adjusted the font size of the dial numbers. This image is in the media folder as ‘redtach.bmp’